Error Budgets: The Financial Department for Reliability

Nico Braun
July 15, 2026
⏳ 10 min
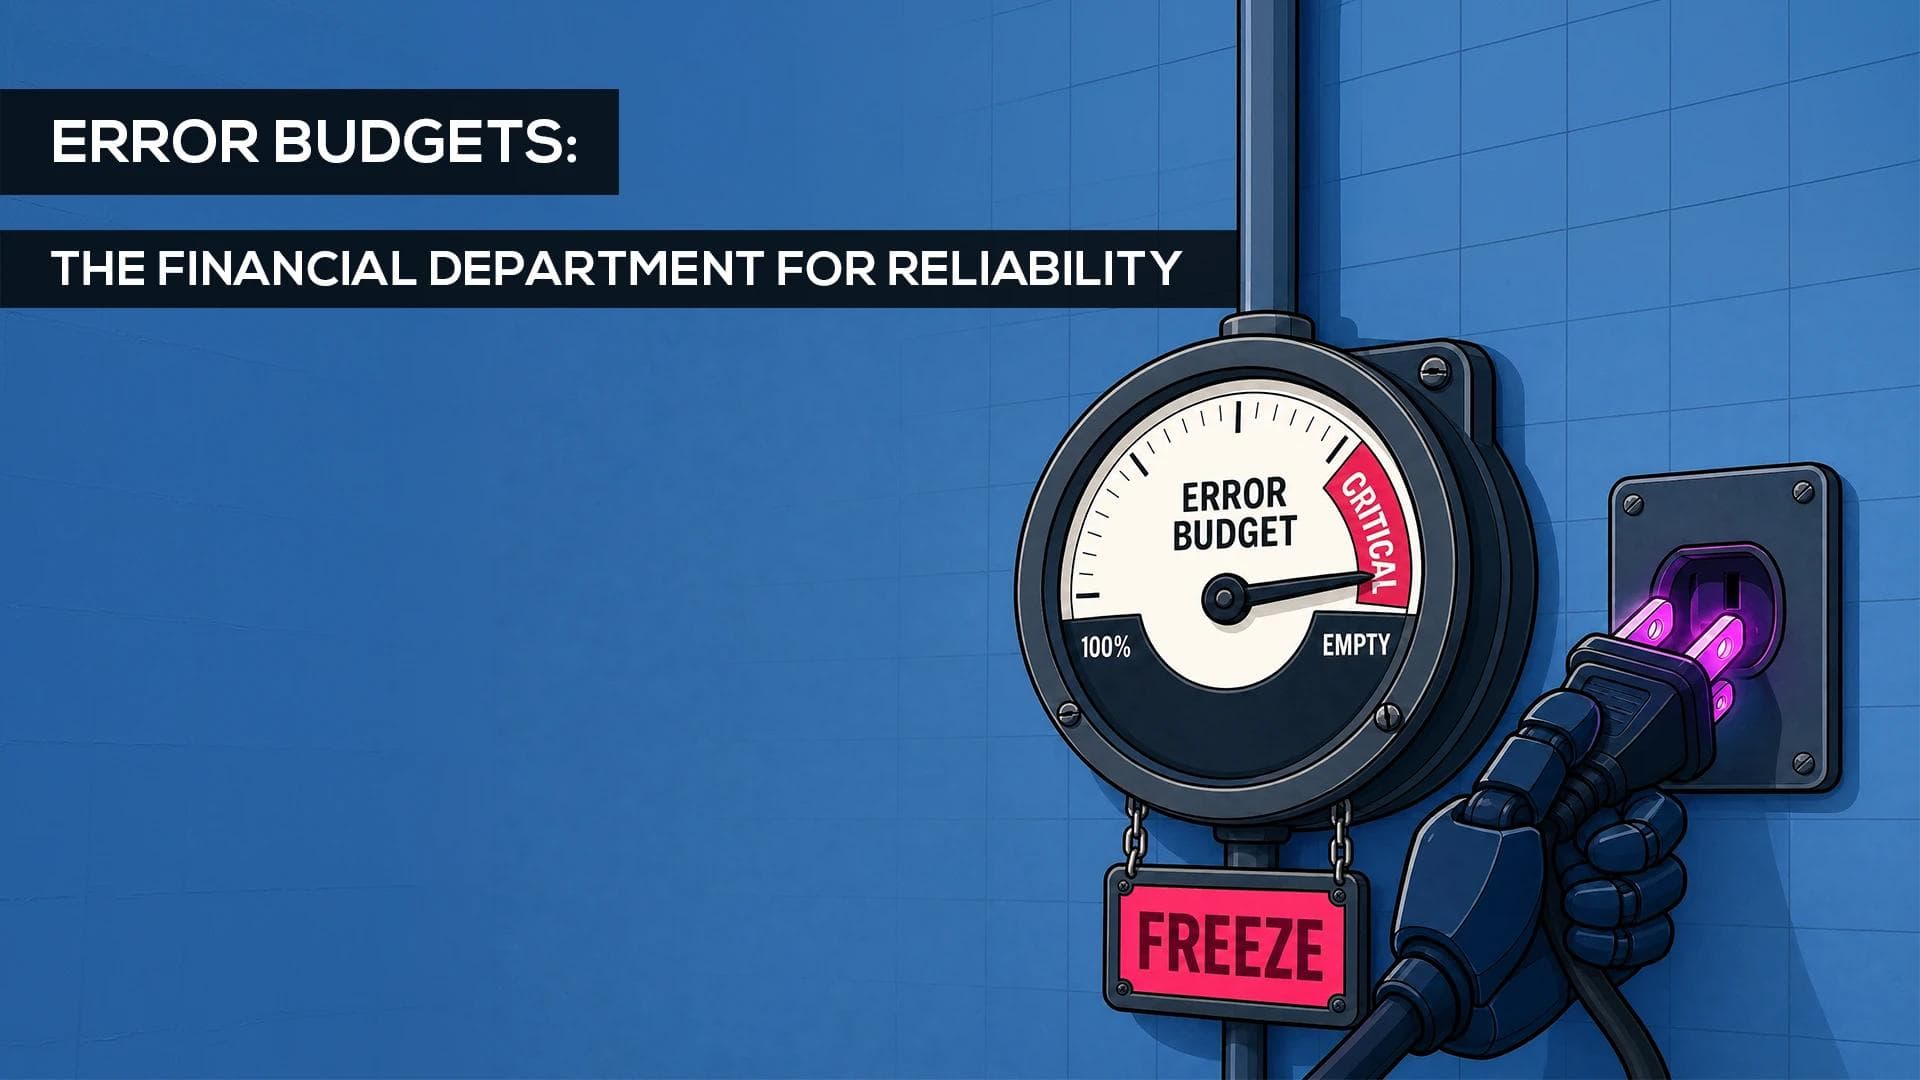
Imagine you’re running a household. You’ve got a monthly budget for “fun stuff”. Eating out, concerts, maybe that slightly-too-expensive LEGO set you’ve been eyeing. You know that if you spend it all in the first week, the rest of the month is going to be pretty thin on the ground. You might even have to dip into your savings. That's exactly why you have a budget in the first place.
Treating IT systems like they should have 100% uptime is like trying to live a life where you never, ever spend a cent on anything unnecessary. It sounds noble, but it’s actually a recipe for burnout, zero innovation and a very boring existence.
On the flip side, ignoring reliability entirely is like blowing your entire pay check by day three. It feels fast and loose, but the inevitable crash is going to be brutal.
In Site Reliability Engineering (SRE), this balancing act has a name: the Error Budget.

"The Fun Fund" jar filled with coins labeled "Safe Failures" and "Calculated Risk"
Put simply: an Error Budget is the amount of unreliability a service is allowed to have before engineering priorities need to change. It provides a measurable framework that connects technical metrics such as SLOs and SLIs with business decisions around innovation, risk and governance.
The Metrics Hierarchy
Before we can talk about budgets, we need to know what we're actually measuring. At shiftavenue, we often see teams confusing their "monitoring" with their "reliability." But there's a huge difference between seeing a spike on a dashboard and knowing if your business is actually suffering.
That's where the SRE Metrics Hierarchy comes in.
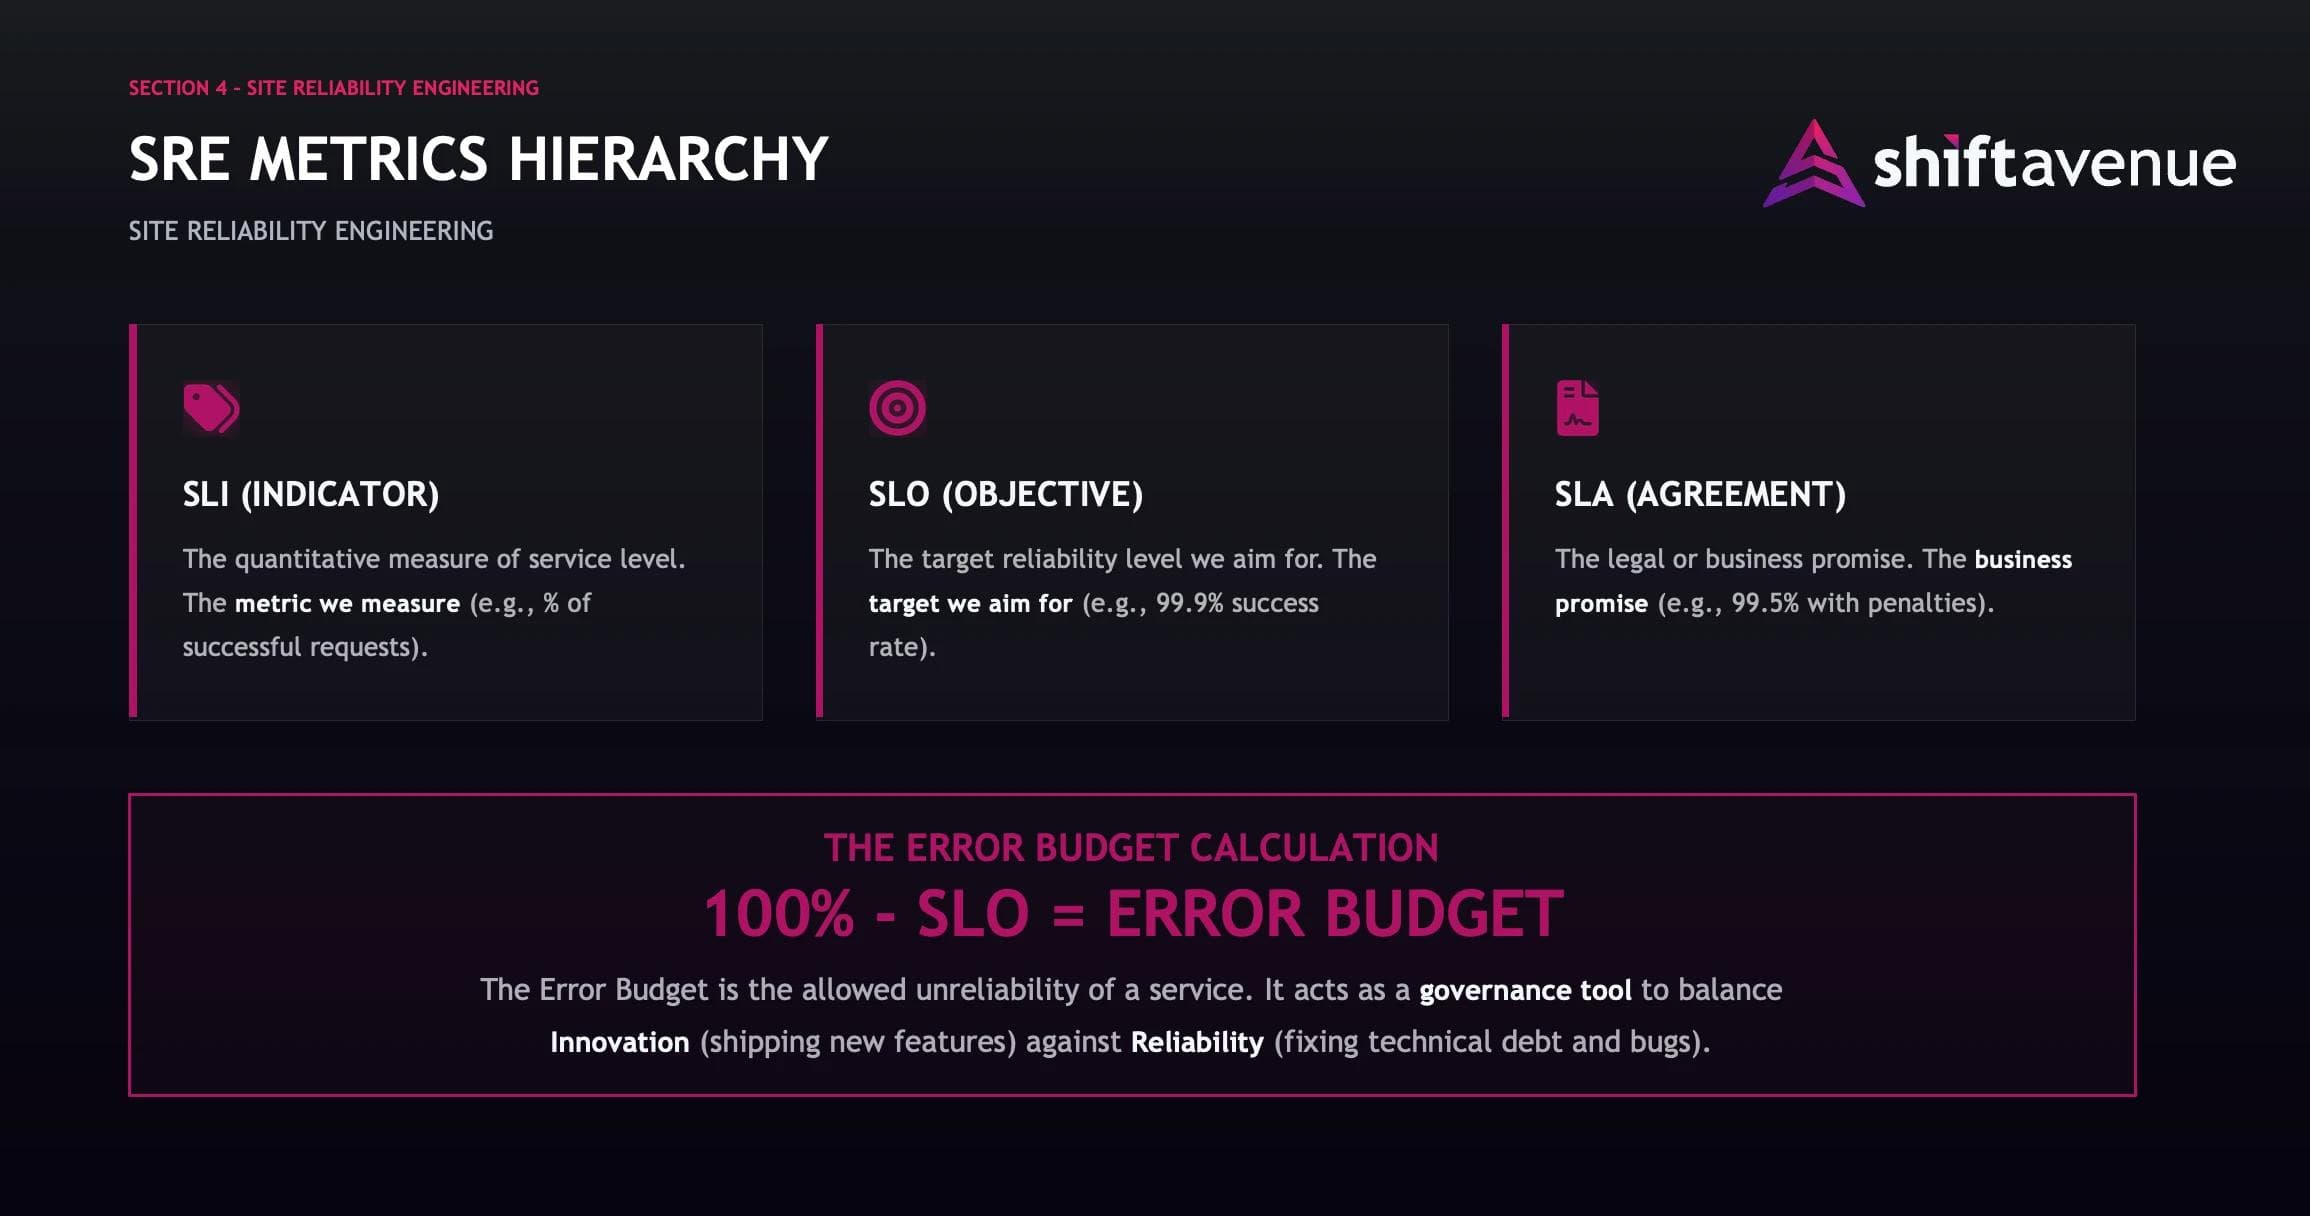
Infographic explaining the SRE Metrics Hierarchy
As shown in the diagram above, we break this down into three distinct layers:
1. SLI (Service Level Indicator)
It’s what we actually can measure. Think of it as the raw data. The percentage of successful requests or the latency of your checkout service.
2. SLO (Service Level Objective)
This is the target we aim for. If our SLI is "successful requests," our SLO might be "99.9% successful requests over 30 days." This is where the engineering happens.
3. SLA (Service Level Agreement)
This is the business promise to customers. If we miss this, there are consequences. Usually financial or legal.
The magic formula is simple:
100% - SLO = Error Budget
If your target is 99.9%, you have a 0.1% "budget" for failure. That 0.1% isn't just a buffer for when things break. It's a license to innovate.
What Exactly is an Error?
It is easy to say "we track errors", but much harder to define what an error actually is in the production process.
A response might return a technical success. But if it takes ten seconds to load, your customer has already abandoned their shopping cart. This is why Google created the Four Golden Signals:
1. Latency: The time it takes to service a request. You must track successful and failed requests separately. A fast error is still an error.
2. Traffic: The sheer demand placed on your system right now. For web services this is usually HTTP requests per second.
3. Errors: The rate of requests that fail. This includes explicit failures (HTTP 500), implicit failures (returning the wrong content) or policy failures (missing a latency target).
4. Saturation: How "full" your service is. This measures your most constrained resources like CPU, memory or database connections.
If you monitor these four dimensions, your service is covered quite well. Your error budget simply burns whenever these signals breach your agreed thresholds.
The Governance (Im)Balance
Oftentimes there is a tug of war between the "Feature Factory" (Product) and the "Stability Guardians" (Operations/SRE). Product wants to ship fast. Ops wants to keep it stable. This is where most organizations fail: they treat it like a zero-sum game.
Without an Error Budget, this is just a loud argument about feelings.
"We feel like the system is unstable!"
says SRE.
"We feel like we're moving too slowly!"
says Product.
Usually, the feature side wins this argument. Why? Because new features are visibly bound to generating revenue, while the financial value of reliability is harder to prove in the moment.
This is why reliability decisions should be driven by data, not intuition.
With an Error Budget, this relationship transforms. It becomes a governance tool that creates a shared language.
Innovation (Velocity):
As long as you have a healthy budget, the team should be shipping. Experiment, push new features, take calculated risks. The Error Budget provides a safe space for failure, which is a prerequisite for rapid change. If you're not failing occasionally, your SLOs might be too loose or you're not moving fast enough.
Reliability (Stability):
If the budget is burning too fast, it’s a signal to stop. You stop shipping new features and start fixing the "how." You address technical debt, improve your pipelines and fix those flaky tests.
Treating IT like a utility you just plug into and consume sounds convenient, but it ignores what it actually takes to keep the lights on. The Error Budget forces you to care about the "HOW."
The Exception
At some point, you'll hit a wall: a critical launch is on the calendar, but your error budget is completely gone. This is where pragmatism beats dogmatism.
Every robust Error Budget needs a built-in exception for these exact moments. Pushing a release on an empty budget comes with a strict price tag: an immediate, mandatory commitment to reliability work in the very next sprint. It's a loan, not a gift.
Understanding the Burn: Not All Failure is Equal
This is where it gets really interesting. Look at this chart comparing two different ways a budget can burn:
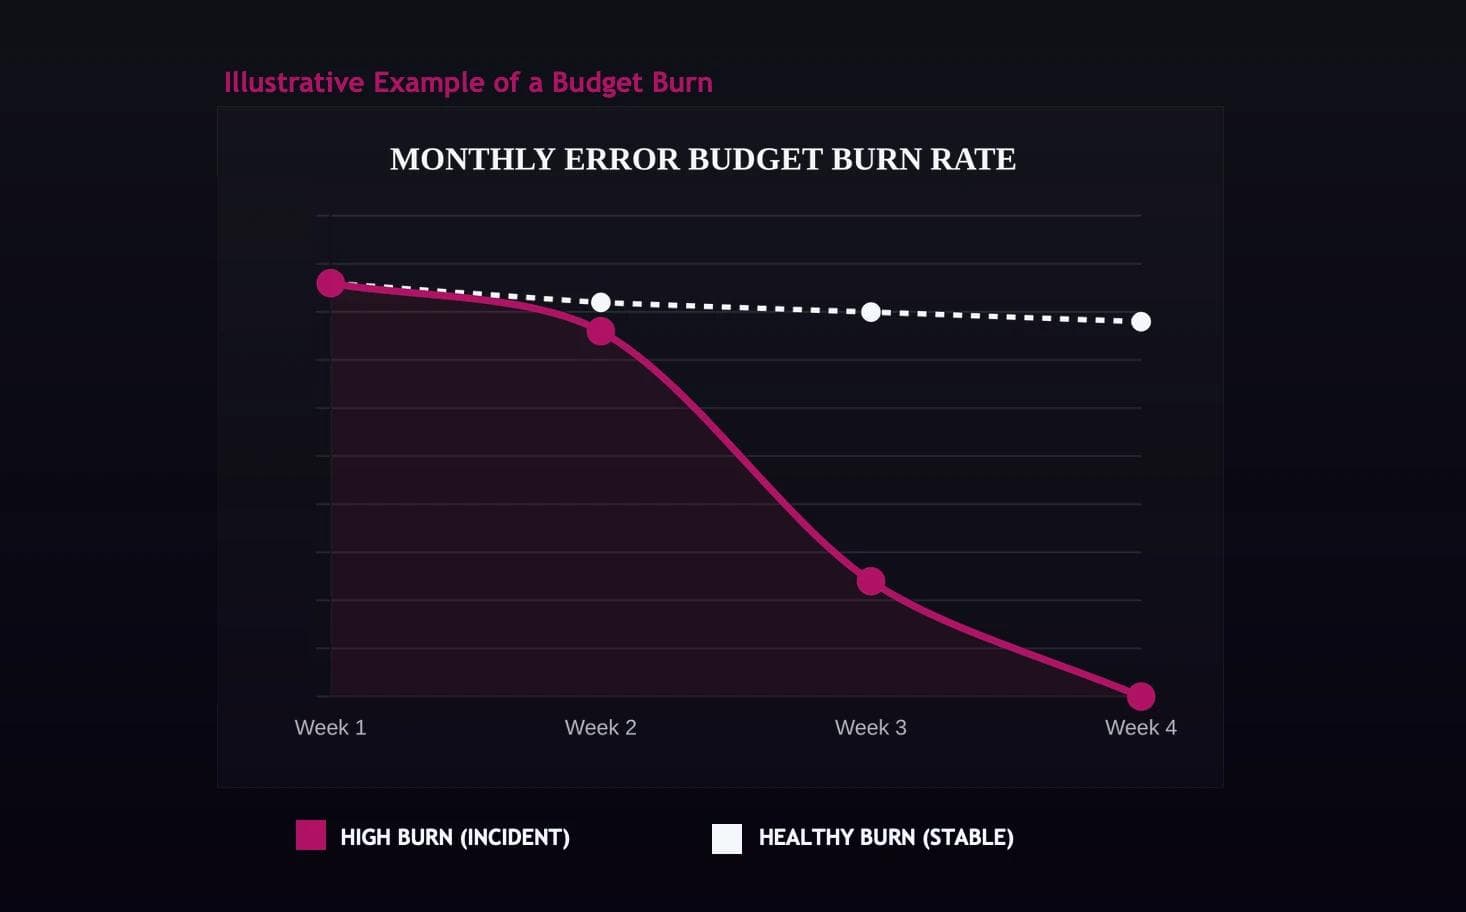
Diagram illustrating an example of a Budget Burn
On one side, there is the Healthy Burn (Stable).
This is a slow, controlled consumption of your budget. It’s expected. It represents the "cost of doing business": minor deployment issues, transient network blips or the occasional minor bug. In fact, if your burn line is a perfectly flat horizontal line, you’re doing it wrong. You're either over-investing in reliability or you're not shipping enough.
On the other side, you see a High Burn (Incident).
Look at what happens around Week 2 in the chart. The budget starts dropping sharply. By Week 4, it's gone. This is a signal that your system is no longer reflecting its intended reliability.
Monitoring the Burn Rate is actually more important than focusing on the remaining budget. If you're 10% through your budget but your Burn Rate is 100x normal, you’re in the middle of an incident already. Waiting until the budget is at 0% to start reacting is a bad idea.
High-performing teams use Burn Rate Alerting to catch catastrophic failures before the budget is exhausted.
The Point of No Return
What happens when that pink line in the chart hits zero? This is the moment of truth for any SRE implementation. If you hit zero and nothing changes, your Error Budget is just a decoration, rather than a governance tool.
This isn't a time for blame; it's a time for policy. A pre-agreed error budget policy should kick in automatically. Common policies include:
- Freeze Releases: No new features allowed. All non-critical feature deployments are frozen. All focus shifts to reliability. Only P0/P1 issues, security fixes or critical reliability improvements are permitted until the service returns to within its SLO.
- The "Reliability Surcharge": Teams may be required to shift their engineering focus entirely to reliability projects (e.g. refactoring brittle code, improving observability or reducing technical debt) until the error budget is replenished. It's about rebalancing the portfolio.
- Post-Mortems with Actionable Outcomes: If an incident burns a significant chunk of your budget (say, more than 20% in a single event), a post-mortem is mandatory. But more importantly, the resulting "reliability action items" must be included in the very next development cycle, indexed above any new features.
The Pitfall of "Loose" SLOs
A common trap is "gaming" the system by setting SLOs that are too easy to hit. If your SLO is 95% but your customers expect 99.9%, your budget will look healthy even as your users are churning. Your Error Budget is only as good as the Service Level Objectives it's based on. They must be grounded in reality: user expectations, not just what's easy to achieve.
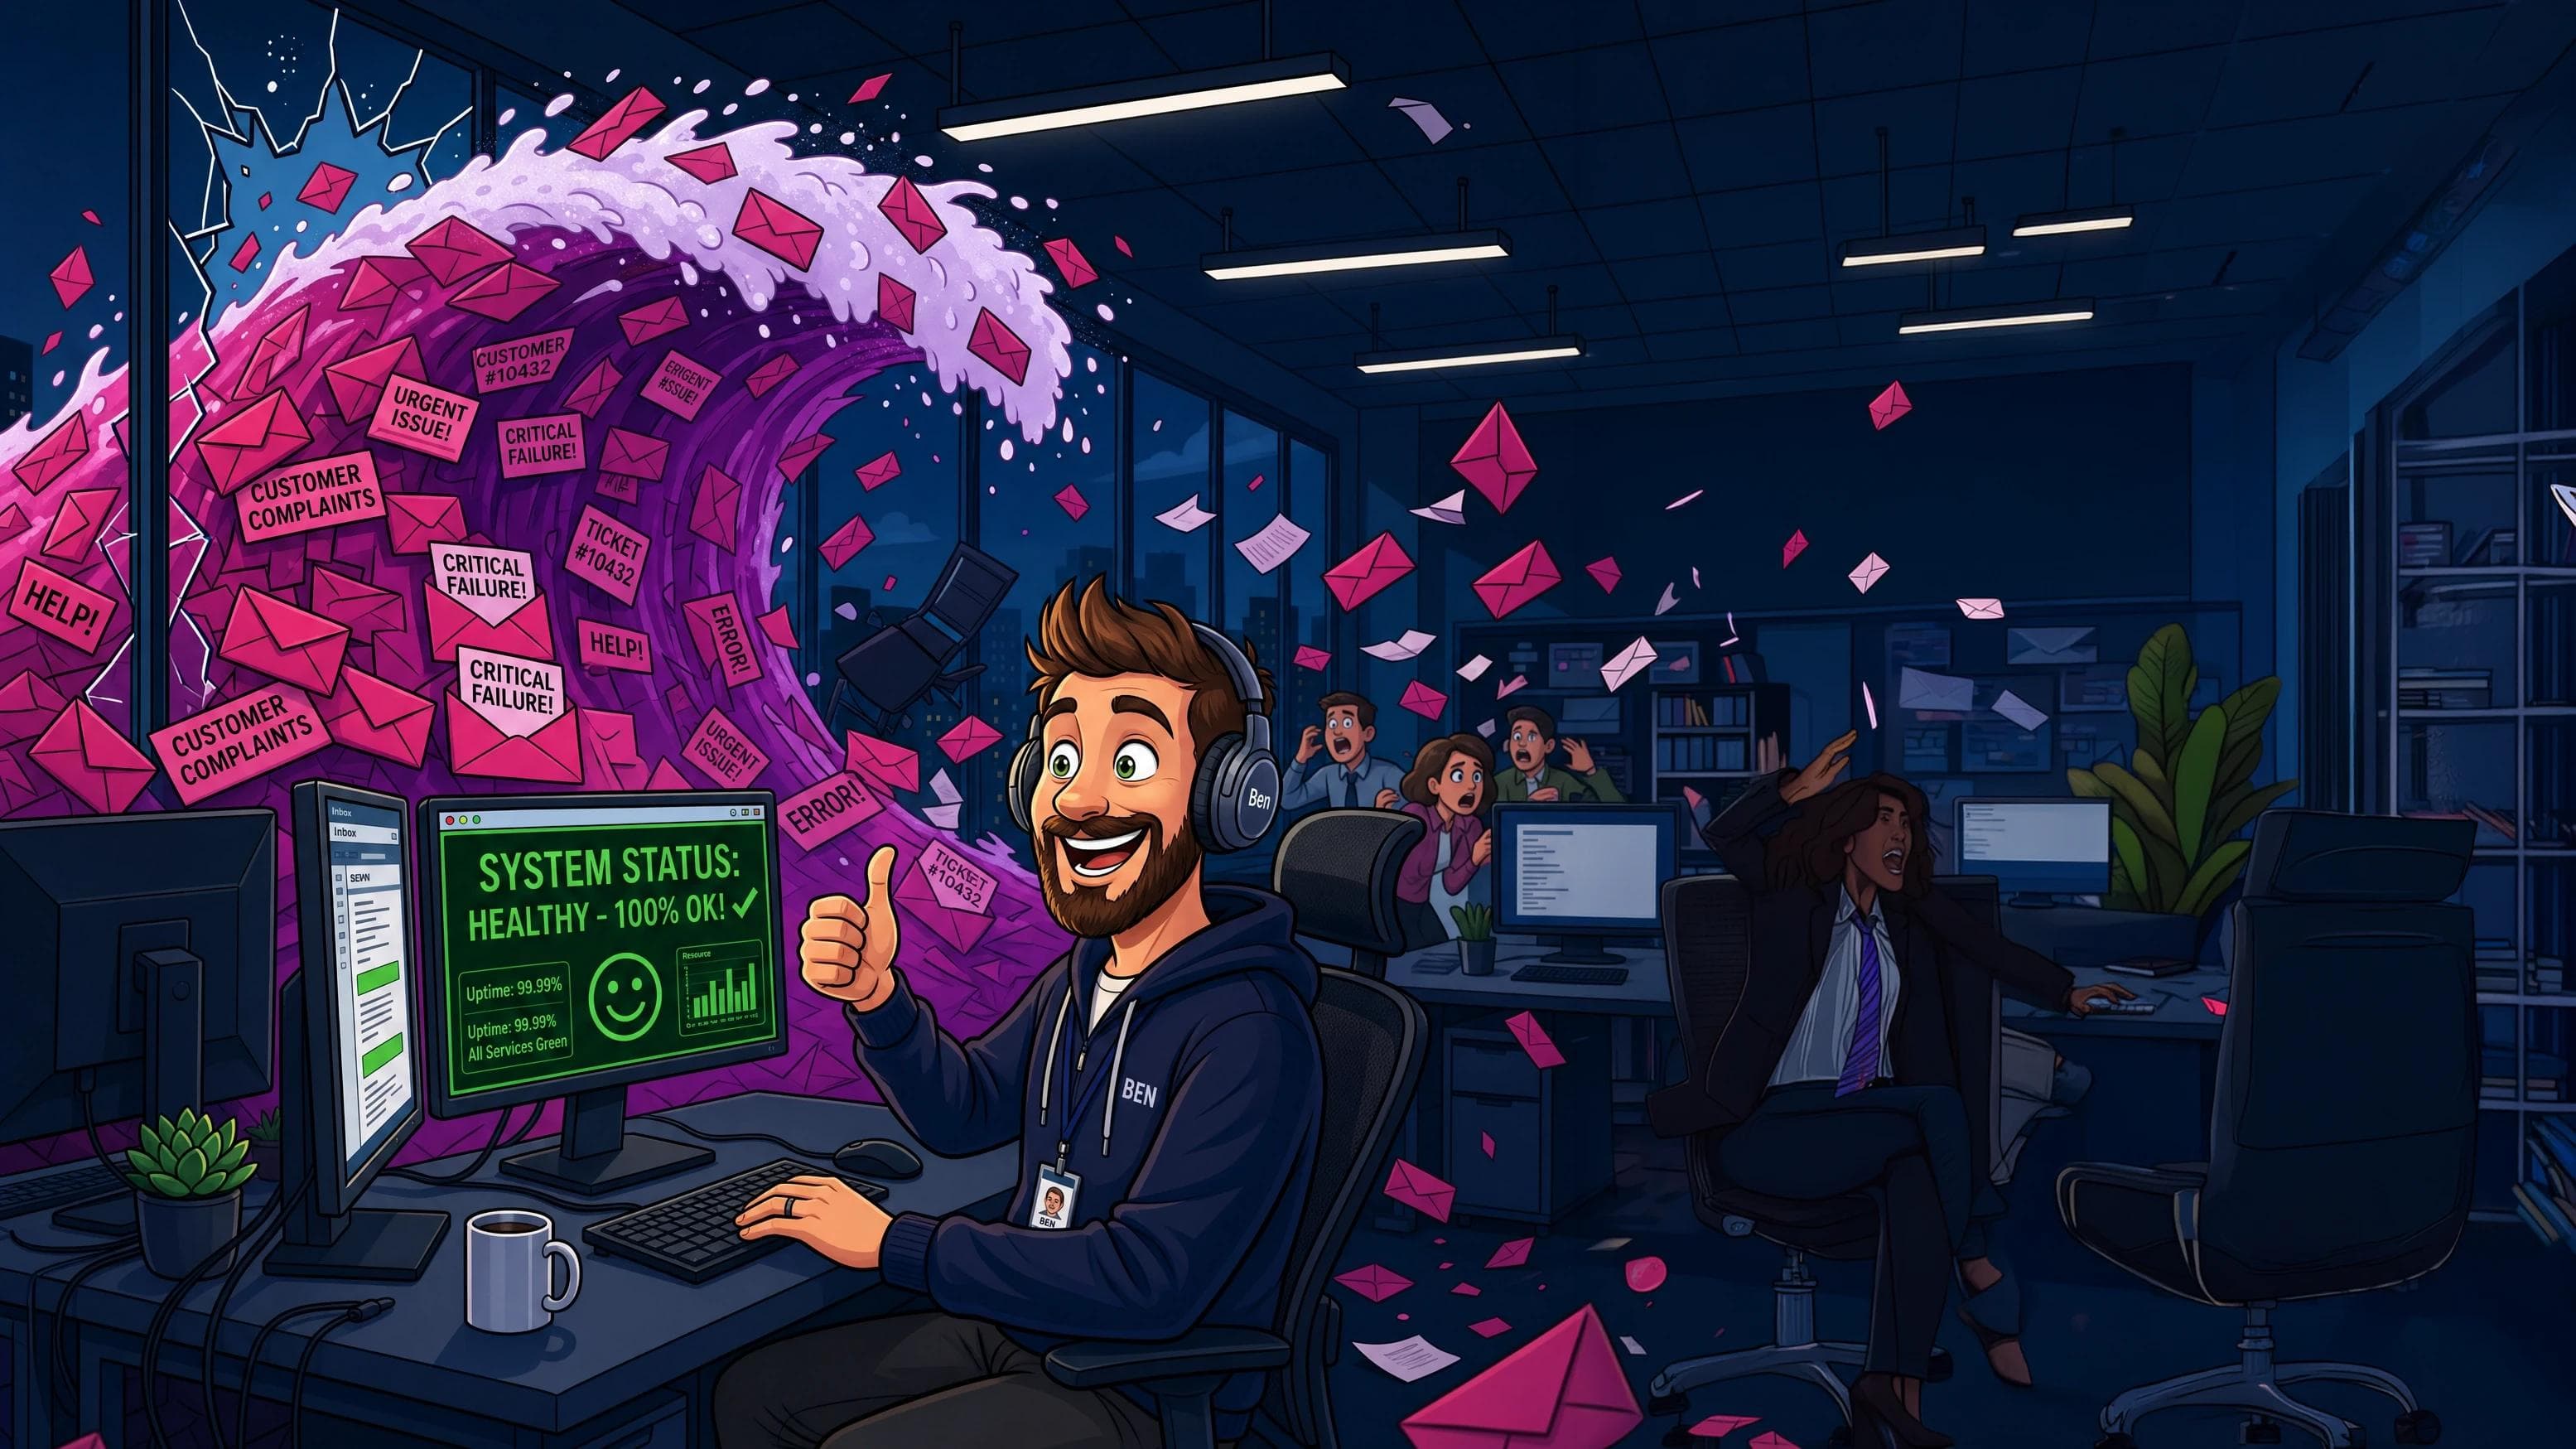
Dashboard showing 100% reliability while customer complaints flood the office.
Conclusion: Reliability is a Shared Responsibility
This is awesome tech, but like a high-performance brake system, it’s only useful if you’re actually willing to hit the pedal when the budget turns red. Implementing Error Budgets isn't just about setting up a dashboard in Prometheus. It’s about a cultural shift in viewing the "how" of your system.
Perfection is not the goal. The goal is to maximize the speed of innovation while maintaining a level of reliability that keeps your customers (and your business) happy and sustainable. It's about moving from "reactive firefighting" to "systems and guardrails."
Next time someone says "100% uptime," just show them the burndown chart. It’s a lot cheaper (and more honest) to plan for the burn. Pragmatism, after all, is the way to build systems that actually last.